Document Type : Original Article
Authors
Laboratory of Advanced Materials and Process Engineering, Faculty of Sciences, University Ibn Tofail, PB. 133, 14000 Kenitra, Morocco
Abstract
Characterizing the corrosion behavior of pipeline brasses undergoing cyclic temperature variation is essential for the prevention of degradation. Two brass alloys, (α+β)-brass and α-brass, were studied to evaluate their surfaces in drinking water at constant and cyclically varying temperatures. Both alloys were immersed for 1h in drinking water at nine different temperatures, starting at 278 K, and going up to 318 K. The two copper-zinc alloys were also immersed for 96 h at both critical temperatures (278 K and 318 K) and room temperature. To study the effect of cyclic temperature variation, immersion tests at cyclically varying temperatures were done between the two critical values for 4 cycles. The results of an integral electrochemical analysis using (PDP) and (EIS) revealed that the two alloys react differently under the same experimental conditions. The corrosion rate has approximate values for the cyclical temperature change of 3.04 µA cm-2 for α-brass and 3.26 µA cm-2 for (α+β)-brass. Impedance tests also show that α-brass tends to hold up remarkably well with 130.5 KΩ.cm² of polarization resistance versus 94.1 KΩ.cm² for (α+β)-brass. Similarly, degradation was observed in both alloys during cyclic temperature changes. The etched surfaces of the alloys were examined using SEM-EDX to obtain a clearer understanding of the surface morphology. The SEM images showed that an oxide film protects the surfaces. Monitoring of Cu2+ and Zn2+ ions in the electrolyte by ICP provided a detailed idea of the leaching of these metals.
Graphical Abstract
)
Keywords
Main Subjects
Introduction
Brass is an alloy widely used in plumbing because it has a perfect arrangement of properties. It is corrosion-resistant, has very high thermal and electrical conductivities, and has better machinability. Its properties make it widely used in water distribution systems, elbows, buried pipes, domestic pipes, and taps. With different additives, such as Iron, Nickel, and Lead, brass can have better mechanical properties, machinability, and resistance to corrosion and breakage [1]. Because ordinary Cu-Zn alloys have very poor machinability, adding other elements is necessary to increase their performance [2]. Among these, lead is an almost insoluble element in the copper-zinc matrix. It gathers in the form of "islands" in the alloy [3] and improves machinability, provided that it does not exceed 3% to prevent breakage. However, lead-brass is the primary source of Pb in drinking water. Lead leaching is a severe health problem because of the inability of the human body to remove it once absorbed [4,5]. In 2003, the World Health Organization (WHO) suggested that Pb should not exceed 10 mg/l from brass in contact with drinking water [6]. However, Pb in drinking water pipes remains a public health problem [7-9], especially in children [10]. Replacing Pb with Si and Phosphorus allowed it to retain high performance in terms of dezincification resistance according to the dezincification test "DIN EN ISO 6509" [11]. However, the machinability of lead-free brass remains significantly lower than leaded brass [12]. Although lead-free brass CuZn21Si3P has become a powerful and healthy alternative for drinking water pipes, leaded brass is still widely used. Dezincification is always involved in the corrosion of brass, which can occur as soon as it is exposed to slightly aggressive conditions [13,14]. Dezincification can be due to several factors that influence not only the microstructure of the copper-zinc alloy, but also that of all the additive elements [15]. Among these factors, temperature is known to accelerate the process of dezincification [16-19]. Still, the relationship between temperature and corrosion is not simple, as the former also directly affects all the chemical, physical, and even biological parameters related to corrosion [20,21]. The microstructure of brass plays a role in this corrosion process: lead-rich brass is mainly composed of two phases (α+β); the α phase is rich in copper, and it plays the role of the cathode because copper is the noblest element. The β' phase is rich in zinc and first undergoes dissolution [12]. Lead-free silicon brass is also the double phase; it is made up of the α phase and the ҡ phase, which is very hard because it is rich in Silicon, and it is this which is sacrificed first [12,13].
According to electrochemical kinetics, when the temperature increases, the corrosion rate increases, for example, in the case of copper, iron, and lead. This increase was observed when the temperature exceeded 303 K [22]. In theory, the rate of chemical reactions increases with an increase in temperature. However, the solubility of some products and byproducts of corrosion is inversely proportional to the temperature [8,13,20]. This is the case; copper hydroxide decreases with increasing temperature [23]. However, literature rarely discusses the impact of cyclic temperature changes caused by climate change [20,24]. Studies on Pb levels in drinking water related to seasonal changes (winter-summer) have found that they are always higher in summer than in winter. Specifically, researchers reported high levels between May and November [25]. Studies have also reported that copper levels are three times higher in hot tap water than in cold water [26]. Laboratory investigations have been particularly precise regarding temperature values, as it was found that the level of copper at 333 K is much higher than that in water at 277 K and 297 K [21]. In the literature on cyclic temperature and corrosion, small-scale diurnal and nocturnal temperature changes have not been studied, and the effect of cyclic temperature on the corrosion behavior of brass has not been reported anywhere. Owing to their different microstructures, brasses exhibit other dezincification behaviors. This study investigates the effect of cyclic temperature variation on corrosion degradation and, more specifically, on the dezincification behavior of two-phase lead-rich brass alloy CuZn36Pb2As and single-phase lead-free brass alloy CuZn21Si3P in contact with tap water.
Experimental
Materials
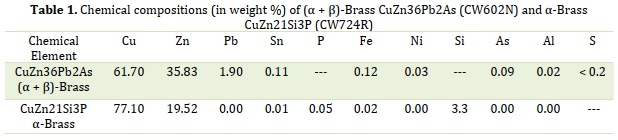
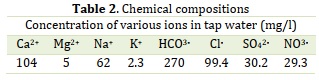
Two copper-zinc alloys were used in this study. The first is the leaded brass alloy (Dezincification-Resistant) CuZn36Pb2As, a two-phase (α+β)-brass, and the second is lead-free brass CuZn21Si3P, a single-phase α-brass. The nominal chemical compositions (wt. %) of the two brasses are listed in Table 1. The electrochemical tests were carried out in tap water whose chemical composition is presented in Table 2. The solution complied with the compositional requirements for drinking water issued by the WHO [27]. The parts were coated with PTFE to maintain a surface area of 1 cm2 The parts were coated with polytetrafluoroethylene (PTFE). Before electrochemical testing, all parts were mechanically polished with silicon carbide (SiC) abrasive paper to 7,000 (3 µm) and then with a felt cloth soaked in 1µm grade diamond paste.
Methods
Temperature variation is a factor that affects corrosion of drinking water and the environment. By simulating day-night temperature changes in semi-arid areas, the temperature varied between a minimum value of 278 K and a maximum value of 318 K. The inner wall is always in contact with drinking water. This simulation is carried out with a thermostatic cell connected to a water bath, which modifies the water temperature, as displayed in Figure 1.
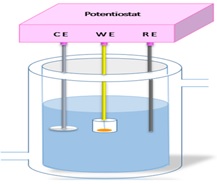
Figure 1. Thermostatic cell
Three groups of experiments were conducted. First, a wide range of temperatures of nine different values was chosen from 278 to 318 K, and electrochemical tests were performed after one hour of immersion. Based on the results of the electrochemical tests, the corrosion current densities and the most critical polarization resistances were 287 K and 318 K. Secondly, the surfaces of the alloys were conditioned at the critical temperatures for 96 h. For a logical comparison and to verify the effect of these temperatures on the natural passivation of the formed film, which is more noble and resistant, the alloys were also placed at room temperature for the same immersion time (96 h) (Figure 2). Finally, to study the effect of temperature variation on the behavior of both alloys, electrochemical tests at cyclic temperatures between the two critical values of 278 K and 318 K were conducted over four cycles (Figure 3) for 96 h. To perform the four cycles of exposure tests in drinking water, the samples were installed in a double-walled thermostatic beaker (Figure 3) to react to temperature changes coming from the water in a water bath and pumped by a submerged water pump. The temperatures were chosen to imitate the climatic conditions in Morocco, whose night temperature in some regions reached 278 K, whereas the daytime temperature exceeded 318 K. The temperature alternated between the minimum value of Tmin = 278 K and the maximum value of Tmax = 318 K every 12h. Each cycle lasted 24 hours.
ΔT = Tmax – Tmin
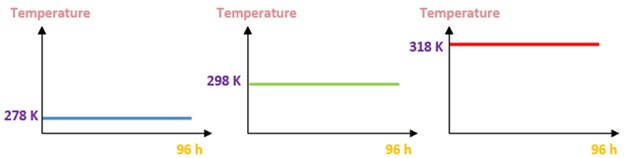
Figure 2. Fixing temperature during 96 h at 278 K, 298 K, and 318 K
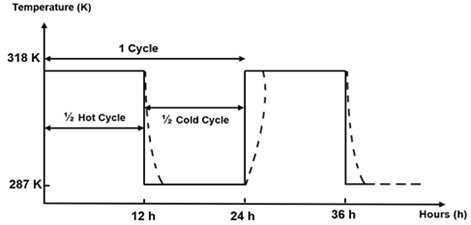
Figure 3. Cyclical temperature change
Testing was performed at 298 K and room temperature for credible evaluation. Tap water was collected only once to ensure the same level of metals during all the tests to obtain reliable results. All samples were immersed for the same duration (96 h) in aerated tap water, which promotes dezincification. The electrochemical corrosion tests were performed after each manipulation. Each test included a study of the cathodic and anodic polarization curves, whose corrosion potential and current were measured using Tafel lines and Electrochemical Impedance Spectroscopy (EIS) with an equivalent circuit of the metal-solution interface. The tests were carried out sequentially using the same electrochemical cell with three electrodes. Each experiment was repeated at least thrice under the same experimental conditions.
Scanning electron microscopy (SEM) was used to inspect the surface morphology of each sample after the tests. To obtain a clearer understanding of the crystal evolution, the number of tests was doubled to eight. This was accompanied by an Energy Dispersive X-ray (EDX) microprobe to focus on the most attacked parts. The ICP results were obtained and used to determine the rate of metal leaching in tap water for both brass types. The inductive Plasma Spectroscopy (ICP-OES) technique was used by immersing samples with a surface area of (1 cm2) of the two alloys in 300 ml of tap water contained in sterile glass tubes while changing the temperature cyclically between 278 and 318K. After 96 h, 1 ml of solution was taken from each solution. All ICP-OES measurements were carried out at 25 °C.
Experimental device
electrochemical impedance spectroscopy (EIS) and potentiodynamic polarization (PDP) measurements were carried out on the two samples after stabilization of the open circuit potential by the ZIVE sp1 type Potentiostat/Galvanostat. connected to three electrodes: the saturated calomel electrode as the reference electrode, the platinum electrode as the counter electrode, and the brass samples as the working electrode. EIS measurements were performed over a frequency range of 100 kHz to 10 mHz with 5 points per decade. Electrochemical impedance spectroscopy traces were analyzed by equivalent circuits. On the other hand, the potentiodynamic polarization (PDP) measurements were carried out over the range of potential variation between -600 and +600 mV/ECS at a sweep rate of 1 mVs-1. The icorr and Ecorr corrosion parameters were obtained by extrapolation from Tafel's rights. To obtain reliable results, each experiment was repeated at least twice under the same experimental conditions. Subsequently, the surfaces of the samples were analyzed by SEM using an FEI Quanta® 200 SEM instrument coupled with an EDAX probe microanalysis under high vacuum and 30 kV EHT. However, the percentage chemical composition of the samples was examined by EDX. Finally, the used ICP-OES device is the Optima 8000 ICP-OES Spectrometer.
Results and Discussion
Electrochemical study of short-term duration
The first corrosion test involved electrochemical impedance monitoring and polarization curves after immersion of both alloys in aerated tap water for 1 h at different temperatures. The polarization resistance and icorr values provided a general idea of the influence of temperature (Figures 4 and 5). Figure 4 demonstrates more diffusion levels in the cathodic range of two-phase brass than in single-phase brass. The explanation lies in the well-known fact that copper alloys in a neutral medium are characterized by the diffusion of oxygen, which is even more evident in Figure 6.
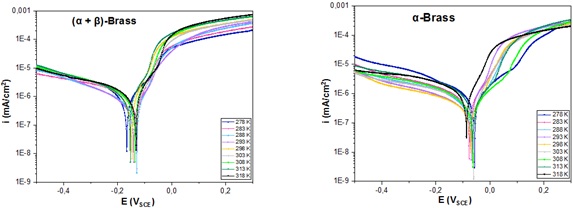
Figure 4. Polarization curve of α-brass and (α + β)-brass in tap water for 1h at different temperatures (278 K, 283 K, 288 K, 293 K, 303 K, 308 K, 313 K, and 318 K)
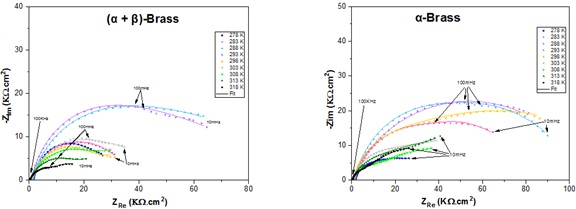
Figure 5. Electrochemical Impedance diagrams of α-brass and (α + β)-brass in tap water for 1h at different temperatures (278 K, 283 K, 288 K, 293 K, 303 K, 308 K, 313 K, and 318 K)

Figure 6. Cathodic branches of (α + β)-brass and α-brass with stirring (500tr/mn and 1500 tr/mn) for 1h immersion in tap wate
As can be seen, the cathodic slope increases with the agitation speed for (α + β)-brass but remains identical in the case of α-brass. This result highlights that diffusion controls the corrosion mechanism via oxygen reduction, according to Equation (1) [28,29]:
![]()
Since the alloys contain zinc, dezincification occurs by the formation of a film of zinc oxide, which triggers an additional passivation, according to Equation (2) [29]:
![]()
The dissolution of copper is the essential anodic reaction in neutral solutions with chloride, as indicated in Equation (3) [30]:
![]()
The deposition of elemental copper is convenable at two different potentials in a solution, as summarized in Equations (4) and (5) [31]:
![]()
In the case of leaded-brass, the mechanism in a 10% zinc chloride solution suggested by Lucey suggested the elimination of Cu2+ according to Equation (6) [31,32]:
![]()
The formation of a copper film stops the dezincification in the reaction (5) by the unavailability of the Cu2+ particles for the reduction and the Arsenic is always recovered by the reaction below (Equation (7)) [33]:
![]()
In lead-free brass, phosphorus is the corrosion-inhibiting element of α-brass. The phosphorus particles act homogeneously with Arsenic according to the reactions below (Equations (8) and (9)) [34,35]:
![]()
The anodic branches of the Tafel plots of α-brass and (α+β)-brass exhibit different behaviors (Figure 4). For the (α + β)-brass alloy, a relatively high current density was observed over the entire temperature range, indicating active corrosion and the rapid dissolution of copper and zinc. However, parts of the anodic current densities in the same potential region for α-brass were less intense, indicating a slower alloy dissolution rate. The cathodic current density was high in cold solutions (278 and 283 K), which can probably be explained by breaking oxygen immobility in the solution at low temperatures. This limits the formation of protective oxides on the surfaces of both alloys. It was also observed that each alloy maintained a density zone related to its dissolution. The current density values obtained for α-brass and (α + β)-brass at 278 K were 1.24 µA.cm-2 and 2.11 µA.cm-2, respectively, providing evidence that α-brass is more resistant than (α + β) brass. The literature suggests this resistance is mainly due to the additive elements of α-brass, which play an inhibitory role through the phosphorus and silicon cycles [33,36-37].
After the simulation of all the impedance curves plotted in the graphs (Figure 5), the polarization resistance values were recorded. Figure 7(b) shows the Rp evolution as a function of a wide range of temperatures after immersion for 1h. It was observed that (α+β)-brass has a better resistance at 288 K, and α-brass is very resistant at 298 K, which is also evident in the curves of icorr hence, the proportionality is inverse.
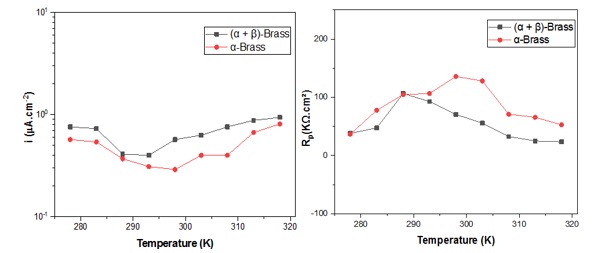
Figure 7. icorr and Rp values of (α + β)-brass and α-brass in tap water during 1 h at different temperatures (278, 283, 288, 293, 303, 308, 313, and 318 K)
Electrochemical study of long-term duration
Polarization curve
Several electrochemical polarization curves at different temperatures after immersion were measured for each sample. The scanning speed selected to plot the polarization curves was 1 mV/s. The corrosion parameters icorr and Ecorr were determined using the Tafel method of the cathodic polarization curves. As illustrated in Figure 8, after 96 h of immersion at room temperature, the corrosion potentials of both alloys had the most negative values compared to the other temperatures of -235 mV and -230 mV, respectively. The following corrosion potential values were observed at high temperatures for both alloys, whereas at very low temperatures, the potential approached more positive values for both alloys. In the cyclic mode of temperature variation, the potential was -174 mV for (α + β)-brass and -162 mV for α-brass. The results show that both types of brass have the same potential variation trend concerning the temperature.
Figure 9 depicts a plot of the variation in icorr concerning temperature. The plot shows that the lowest values of current density are those that occur at low temperatures with 0.6 µA.cm-2 and 1.4 µA.cm-2 for α-brass and (α + β)-brass, respectively. The highest values were those at 318 K, with 3.41 µA.cm-2 for α-brass and 4.36 µA.cm-2 for (α+β)-brass, respectively. The icorr values of temperature change, the values are slightly different, with 3.0 µA. cm-2 and 3.2 µA. cm-2 for α-brass and (α+β)-brass, and the color values in the cyclic mode of temperature change are slightly different [38]. The fit for 1 h may be less accurate, probably due to the short immersion time and the fact that the sample surface was not yet stabilized.
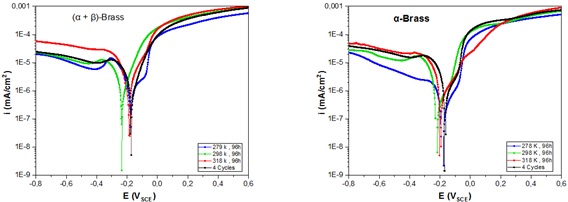
Figure 8. Electrochemical polarization curves of two alloys after immersion in tap water at 278, 298, and 318 K for 96 h and at cyclic temperature for 4 cycles

Figure 9: Values of icorr and Ecorr at different temperatures
The oxidation of zinc develops from the corrosion potential, and the ZnO layer guarantees the passivity of brass until it is broken by dissolution; consequently, the corrosion rate increases [39,40]. Subsequently, copper oxidation was recorded, followed by forming a Cu2O film, which was finally passivated [41].
Electrochemical impedance spectroscopy (EIS)
Impedance Spectroscopy was used under the same experimental conditions to study the metal/solution interface. EIS diagrams in the Nyquist Plane are shown in Figure 10.

Figure 10. Electrochemical impedance diagrams of (α+β)-brass and α-brass in tap water during 96 h at 278 K, 298 K, and 318 K, and for 4 cycles
In previous studies on brass in drinking water [33,42-43], the impedance graphs that were close to the graphs in Figure 10 were fitted with the equivalent circuits shown in Figure 12. The chosen equivalent circuits consisted of the solution resistance Rs. The time constant at high frequencies is represented by the film resistance Rf in parallel with Qf, and it models the dielectric properties of the corrosion products on the alloy surface [44,45]. At medium frequencies, the time constant expressed by Rct in parallel with Qdl signifies the unwinding at the metal-solution interface of charge transfer through the film. At low frequencies, the time constant is described by the parameter W, which is the Warburg diffusion impedance. This parameter is probably linked to the diffusion of copper and zinc ions across the surface, according to certain authors [35,46-47], inserted in series with the charge transfer resistance. The time constants are characterized by Q and n, where Qf is the oxide capacitance, and Qdl is the double-layer capacitance. It is ideal when n = 1 and non-ideal when 0.5 <n <1 [43].
In the high-frequency region, the observed loop was tuned to a protective film of oxides formed on the surface. The size and shape of this loop differed from temperature to temperature in both alloys. From the high-frequency loop of (α + β)-brass at 318 K, this oxide layer decreased, and the flattened shape of the curves of the (α + β)-brass alloy indicates that the surfaces became inhomogeneous after the experiments. Moreover, this layer in the variable temperature mode tends to decrease in the case of α-brass compared with (α + β)-brass. This can be explained by the influence of temperature changes on the quality of the oxides that form this film.
A second loop is observed, which can be related to low frequencies and is commonly attributed to the electrochemical double layer. With increasing temperature, the decreasing charge transfer resistance and increasing charge transfer capacity normally indicate that corrosion increases with increasing temperature.
Table 3 lists the values of the parameters calculated with the simulation, including an estimate of the protective capacity of the oxide film and load transfer resistance. The evolution of the resistance concerning the influence of temperature after 96 h of immersion allowed the calculation of the polarization resistance. The simulation of the impedance spectroscopy results yielded values consistent with those of the corrosion current. The oxide film formed was characterized by film resistance Rf and film capacitance. The film resistance increases with decreasing temperature, reaching 166 KΩ.cm2 and 65 KΩ.cm2 for α-brass and (α + β)-brass, respectively. On the other hand, the charge transfer resistance showed maximum values at low temperatures, with 326 KΩ.cm2 for α-brass and 114 KΩ.cm2 for (α + β)-brass. In the case of variable temperature, the value of Rct was eight times larger than the value of Rf for α-brass and twice as large for (α + β)-brass, as demonstrated in Figure 11. One interpretation is that the protective ability of the oxide layer formed on the surface is mainly due to the charge transfer resistance. The film resistance is remarkably powerful for (α + β)-brass at variable temperatures and may be due to the strengthening of oxides through hot and cold cycles. In most cases, both Rf and Rct showed larger values for α-brass, proving that the protective capacity of α-brass is more critical than that of (α + β)-brass under the different conditions studied.
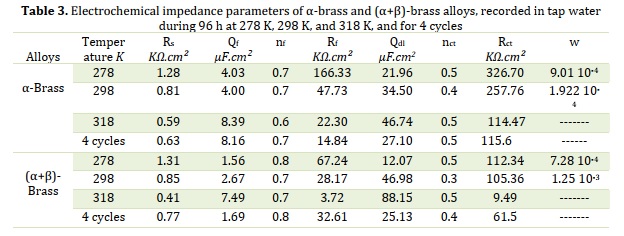
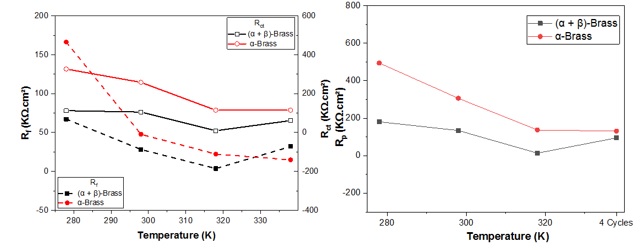
Figure 11. Rf, Rct, and Rp of the two brasses alloys as a function of temperature
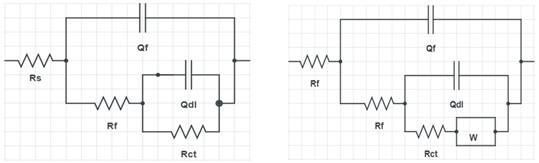
Figure 12. Electrical equivalent circuit models that were used to fit the experimental data of α-brass and (α+β)-brass alloys
Microscopic analysis
Optical microscope
Figure 13 shows the microscopic morphologies of the samples under cyclic temperature conditions. The surface changed to a darker color and was stained dark brown. In addition, dezincified areas appeared in both the samples. Microscopic images show dezincification plugs on the surface of the (α + β)-brass alloy, indicating a double attack. In addition, intergranular corrosion was observed, probably due to the high arsenic content [31-32,41]. Less distinct dezincified areas have been noticed.
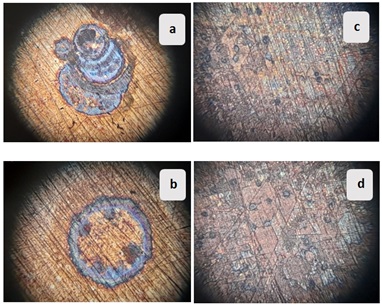
Figure 13. Microscopic morphology (magnification x25) of (a), (b): alloy (α + β)-brass, and (c), (d) α-brass alloy; after immersion in tap water for 4 cycles
SEM-EDX Data Analysis
Scanning Electron Microscopy (SEM) and analysis (EDX) were performed before and after the tests. In addition, snapshots were taken before (Figures 14 (a and b)) and after the 96 h immersion time at the low temperature (Figures 14 (c and d). Additional images were taken at room temperature to better compare the effect of temperature on the conditioning of oxide formation on the surface of both types of brass (Figure 15).
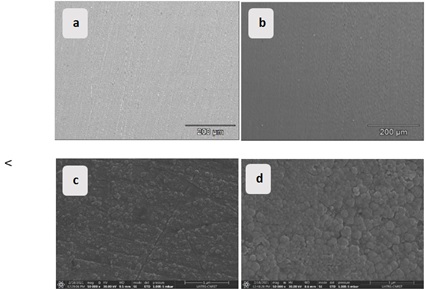
Figure 14. SEM micrographs after polishing (a), (b), and after 96 h of immersion in tap water at 278 K, and (c), (d) of (α + β)-brass and α-brass respectively
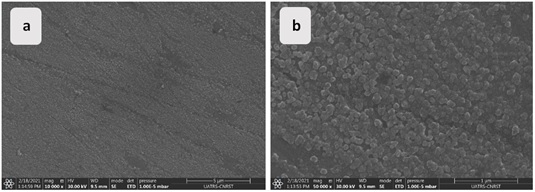
Figure 15. SEM micrographs of α-brass after 96 h of immersion in tap water at 298 K
To compare the globular morphology as a function of temperature, SEM images are taken of the same duration at 278 K. On a scale bar of 1µm, the growth of ZnO and Cu2O crystal grains at low temperatures was observed. For the (α + β)-brass alloy, the oxide layer formed on the surface is non-uniform, with bare areas identified, and even the size of the oxides is much smaller compared to those formed on the surface of the α-brass alloy. This is even though they are made of the same corrosion products [48]. Under ambient conditions after 96 h of immersion, a protective oxide film is observed on the surfaces of both alloys (Figures 15 (a and b)). Nevertheless, the film observed on the surface of α-brass is homogeneous and compact, indicating that it is more resistant (Figures 16 (a and b)).

Figure 16. SEM micrographs after 96 h of immersion in tap water at a cyclically changeable temperature of (α + β)-brass (a, b, and c) and α-brass (d, e, and f) during 4 cycles
At cyclic temperatures, the oxides on the surfaces have different shapes, and the compositions displayed on the EDX analysis are also different. For (α + β)-brass, the oxides are dispersed on the whole surface and compose a non-homogeneous film with dezincified zones (Figures 16 (a, b, and c)). For the alloy α-brass, the presence of very small-sized oxides that resemble each other was detected (Figures 16 (e and f)), constituting the products of corrosion. This layer of oxides is uniformly compact and of the same morphology over the entire surface. The peaks of the EDX technique showed that the corrosion products consist of copper and zinc oxides. The presence of a significant percentage of Silicon, in the form of Silicon oxide and Silicate [45], was found in Figures 18 (d-1, d-3, and d-4). Among the corrosion products detected are the chlorides, which are typically complex with copper to form CuCl2 crystals (Figures 18 (d1-d4)). The EDX peaks in Figure 17 (a-3) showed traces of Aluminum and high concentrations of Nitrogen that come from Nitrates existing in the water itself (Figure 17 (a-2)). Similarly, calcium with carbon in Figure 17 (a-4) complexed to form calcium carbonates, a known form of scale. The presence of Oxygen and zinc justifies the formation of a significant mass of zinc oxide and copper oxide in the corrosion product. On the attacked surface in Figure 16 (a), the presence of lead was noticed on the bare area [49]. To identify the oxides formed on the surfaces of the two samples as a function of time, SEM images at varying temperatures during 8 cycles were taken. Images (b) and (e) in Figure 19 show a much more evolved partial film formation. A quantitative increase in the oxides was noticed by doubling the number of hot/cold cycles. The oxides reform according to defined gaits and finer morphologies, constituting their known patterns [50,51]. At more minor scales down to a few nanometers, the surface of both alloys shows a progression in the number of oxides formed on both surfaces, keeping the difference in the morphology of these oxides.

Figure 17. Spectra EDX of (α + β)-brass alloy after 4 variable temperature cycles in tap water

Figure 18. Spectra EDX of α-brass alloy after 4 cycles of variable temperature in tap water
On the alloy α-brass in Figure 19 (f) surface, the oxides that were created under conditioning become increasingly compact and dense and cover the whole surface. The colloids of the Cu2O copper (II) oxide particles invade large areas of the etching surface. Meanwhile, the copper oxide morphology develops, and individual octahedral particles of Cu2O appear [52]. In the same way, the zinc oxide particles progress. As a result, the increase in cycles causes the disappearance of agglomerates and the appearance of new structures in the form of rushes.
For the (α + β)-brass alloy, the new oxides, formed mainly of zinc oxide and calcium carbonates, appear dispersed, are small in size with a rounded shape, and are disordered. In the images (Figure 19 (c)), the appearance of cracks due to the repetitive cycles of temperature and the leaching of copper and zinc during the cycle followed by their non-homogeneous redeposition during the cold one.
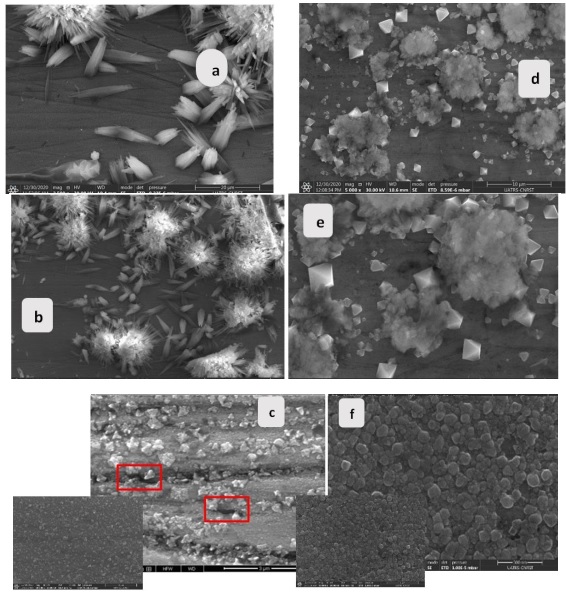
Figure 19. SEM micrographs after 8 variable temperature cycles of (α + β)-brass (a,b,c) and α-brass (d,e,f)
The study of the SEM results showed intergranular microcracks when immersion time was extended at varying temperatures, confirming the results in the literature [25], [52]. As soon as 0.06% Arsenic was added, intergranular corrosion was observed, and the attack was faster as temperature increased [31,33]. It was observed that (α + β)-brass is susceptible to any change in temperature. This could be due to the relatively high Arsenic content that could be responsible for the decrease in the alloy’s resistance to dezincification.
By cyclically changing the temperature, the two alloys react differently. With its high copper content, lead-free brass has the best corrosion resistance, and polarization resistance reaches the maximum value. Lead-free brass also excels in dezincification resistance due to the accumulation of crystals responsible for forming a dense copper layer that stops the dissolution processes. The film that forms on its surface is much more difficult to destroy; therefore, the α-brass alloy is protected against dezincification.
With increasing cycles, the film morphology of the α-brass alloy tends toward the finite form of uniform crystals until passivation.
The areas that experienced a majority of dezincified regions, resulting in corrosion products, consisted mainly of zinc oxides and copper oxides passing through the leaching of zinc or copper ions via the anode and the reduction of oxygen via the cathode. A small portion of the Cu+ ions oxidize to Cu2+ and then convert to Cu2O [53]. This process causes pitting corrosion by chlorine penetration into the pores. The more considerable amount of cuprous ions is complex with chloride ions to form CuCl2, which then reduces to copper at the same location of the initial dissolution [41]. ZnO is also more soluble than Cu2O in chlorine solutions. Therefore, dezincification is expected [26]. During the later stages of exposure, copper corrosion products form above zinc corrosion products and cause a decrease in corrosion rate.
A denser copper layer observed on the surface of dezincified brass is produced by continuous transfer of copper to the metal surface by repeated dissolution and redeposition.
Polarization and impedance measurements for the two alloys under cyclic temperature change are consistent with those obtained from SEM-EDX analyses.
Inductively coupled plasma spectrometry (ICP‑OES)
The leaching graphs in Figures 20 (a) and (b) show that the dezincification of the alloys is affected by the composition of each part and the exposure conditions. Zinc plays a significant role in dezincification, and temperature increase accelerates the leaching of metals. Temperature also affects the amount of meringue accumulated on the dezincified surface, which agrees with the results obtained in other studies [20,52]. The amount of dissolved copper is much lower than that of zinc, which shows that the dezincification process affects both alloys (Table 4). The (α+β)-brass alloy could slightly prevent dezincification at room temperature, and the copper layer produced is found to be uniform and compact due to the presence of Arsenic, avoiding the reduction of copper chlorides to copper [33]. However, it could not resist dezincification after immersion at cyclic temperature. Lead, on the other hand, promotes the leaching of zinc, and high zinc content contributes to the leaching of other metals [49], including copper, produced by continuous surface transfer as part of a permanent redeposition mechanism due to dezincification of brass by cyclic variation of the corrosion rate. This results in a higher density and lighter color of the redeposited copper [43], as confirmed by the ICP plots.
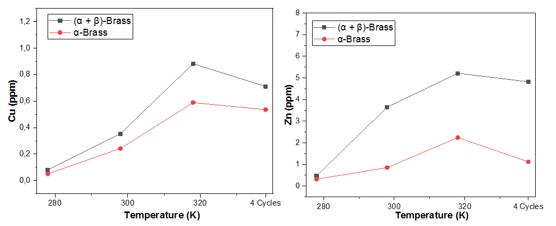
Figure 20. The evolution of Copper and Zinc leaching as a function of the temperature of the single-phase brass alloy and the two-phase alloy

For (α+β)-brass, the amount of dissolved Zn2+ ions decreases slightly when the temperature is variable compared to high temperature. In contrast, the dissolution rate of Cu2+ was significantly reduced in the cyclic mode compared to that at 318 K.
Discussion
Due to the critical composition of water known to be aggressive towards the dezincification of copper-zinc alloys, the modeling of oxide films on the surfaces of two alloys under atmospheric conditions proved to be different.
Electrochemical tests showed that, at low temperatures, the corrosion currents of both alloys were relatively high after 1h of immersion, and the polarization resistance values were in agreement for both single-phase and two-phase brass. The low temperature slowed down the leaching of ions as well as the transport of material in the electrolyte.
During a long exposure time, the alloys experienced high resistance in very low-temperature water, and the degradation worsened with increasing temperature. After 1h of immersion, (α+β)-brass exhibited a maximum strength of 288 K. In contrast, α-brass excels in strength at 298 K. Nevertheless, after 96 h of immersion, both alloys exhibited maximum resistance at low temperatures. The resistances tend to follow an inverse evolution to that of the temperature. In the case of (α+β)-brass, the micromorphological observations and the results of the different parameters indicated that the pressure imposed by the temperature difference ΔT had an affirmative effect on the corrosion. Moreover, the alternating frequency of application of this temperature difference favored more advanced dezincification.
α-Brass showed sensitive behavior to cyclic dezincification at temperature, similar to its behavior at 318 K. The hot/cold period switching is characterized by a corrosion mechanism that can be divided into stages. In the initial stage, anodic dissolution of zinc takes place. Copper dissolution then occurs by anodic reduction of the Cu (I) species. The next step is the reduction of oxygen by cathodic reactions. Finally, the reduced species and copper compounds produced by the corrosion process are re-oxidized by oxygen to copper ions or complexed with chloride ions. The decrease of the corrosion current during the change of hot/cold cycles has been related to coating the whole surface with corrosion products. By multiplying the cycles, the film becomes compact, and its morphology tends towards fine crystals, going as far as passivation, which slows down electrochemical corrosion.
Conclusion
After the test under different temperatures and under a cyclic temperature change between 278 and 318 K, the investigation of the behavior of the (α+β)-brass alloy and lead-free α-brass alloy led to the following results:
- The low temperature slowed the leaching of ions and the transport of material in the electrolyte.
- After 1 h of immersion, brass (α+β) had a maximum resistance of 288 K. On the other hand, α brass exhibited resistance at 298 K.
- Over a long exposure period, the degradation of both alloys worsened with increasing temperature.
- Nevertheless, after 96 hours of immersion, both alloys have the maximum resistance at low temperatures.
- α Brass showed sensitive behavior to cyclic dezincification at temperature, similar to its behavior at 318 K.
- the first step of the degradation mechanism is anodic dissolution of zinc, followed by dissolution of copper by anodic reduction of Cu2O species. subsequently, oxygen is reduced by cathodic reactions and the produced copper compounds are reoxidized by oxygen to copper ions or complexed with chloride ions.
- The increase in hot/cold cycles gives a more compact film which helps slow down electrochemical corrosion.
Orcid
Fatima Hamouche: https://orcid.org/0000-0002-2154-6112
Mohamed Ebn Touhami: https://orcid.org/0009-0003-6383-8230
Yassine Hassani: https://orcid.org/0009-0004-4196-5287
Yassine Baymou: https://orcid.org/0000-0002-8287-7054
Citation: F. Hamouche, M. Ebn Touhami, Y. Hassani, Y. Baymou, Effect of Cyclic Temperature on the Corrosion Behavior of (α+β)-Brass (CuZn36Pb2As) and α‑Brass (CuZn21Si3P) in Tap Water. J. Appl. Organomet. Chem., 2024, 4(1), 30-50.
----------------------------------------------------------------------------------------------------------------------------------------------------
OPEN ACCESS
©2024 The author(s). This article is licensed under a Creative Commons Attribution 4.0 International License, which permits use, sharing, adaptation, distribution and reproduction in any medium or format, as long as you give appropriate credit to the original author(s) and the source, provide a link to the Creative Commons license, and indicate if changes were made. The images or other third party material in this article are included in the article’s Creative Commons license, unless indicated otherwise in a credit line to the material. If material is not included in the article’s Creative Commons license and your intended use is not permitted by statutory regulation or exceeds the permitted use, you will need to obtain permission directly from the copyright holder. To view a copy of this license, visit: http://creativecommons.org/licenses/by/4.0/
PUBLISHER NOTE
Sami Publishing Company remains neutral concerning jurisdictional claims in published maps and institutional affiliations.
CURRENT PUBLISHER
Sami Publishing Company
)